The very first class of APPLIED BUSINESS STATISTICS, 01/07/2013, started with discussing basic statistical concepts. The following types of analysis were explained first:
1. Uni-variate- One variable expression like pie chart.
2. Bi-variate- Two variable expression like correlation
3. Multi-variate- Multiple variable expression like regression
The process/components of Statistical Analysis:
1. Analysis
2. Observation
3. Interpretation
4. Strategy
TYPES OF VARIABLES:
1. Uni-variate- One variable expression like pie chart.
2. Bi-variate- Two variable expression like correlation
3. Multi-variate- Multiple variable expression like regression
The process/components of Statistical Analysis:
1. Analysis
2. Observation
3. Interpretation
4. Strategy
TYPES OF VARIABLES:
- Category variables: Categorical variables have values that describe a 'quality' or 'characteristic' of a data unit, like 'what type' or 'which category. Categorical variables have values that describe a 'quality' or 'characteristic' of a data unit, like 'what type' or 'which category. like preference for veg/non veg, true/false etc. It has the following types:
1. Nominal : Values can not able be organised in a logical sequence. For eg- last 5 digits of a phone number.
2. Ordinal: Values that can be logically ordered or ranked. For eg- fortune 500 list.
3. Scale: Exact difference between variables can be determined. - Numeric variables: Numeric variables have values that describe a measurable quantity as a number, like 'how many' or 'how much'. It has two types:
1. Continuous : Any value between a certain set of real numbers. Example: Height, Age.
2. Discrete : Any value defined in a set of whole numbers. Example: Number of children in a family.
Class further continued with use of SPSS: Statistical Package for the Social Sciences, a software package used for statistical analysis. A quite helpful tool used for research purposes. It is mainly used to run multi-variable regression to calculate the relationship between dependent and independent variables. For example: Return on a stock/equity is dependent upon return on sensex, size of firm, price earning ratio of firm, etc.
Data about usage pattern of Mobile network services of consumers was downloaded from the server in excel format.
Firstly, instructions were provided to how to add and open data in spss. Then various heads in the data view were studied like LABEL, COLUMNS, WIDTH, VALUES, TYPES etc, which helped in organizing and understanding the data.
Data was then analysed using statistical tools like frequency distribution, graphs and histogram ( legacy dialogues), normal distribution curves to check the main reason/factor affecting the choice of service provider. This is also helped in interpreting the skewness (+ve or -ve) in the data. it was also checked whether the graph is right tale or left tale.
If the left tail is longer; the mass of the distribution is concentrated on the right of the figure, then the distribution is said to be left-skewed, left-tailed and if the right tail is longer; the mass of the distribution is concentrated on the left of the figure, then the distribution is said to be right-skewed or right tailed.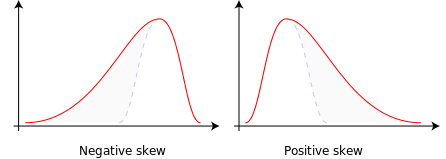
At last, an important tool ; BOXPLOT , was studied to check the outliers and also the mean median relation. The line in the box represents the Median. it divides the data in two half.
The spacing between the different parts of the box help indicate the degree of dispersion (spread) and skewness in the data, and identify outliers.
GROUP:
Neeraj Garg 2013166
Pallavi Gupta 2013187
Piyush Mittal 2013197
Prerna bansal 2013209
Priya Jain 2013210
No comments:
Post a Comment