18th July Lecture 1
There are 3 Methods of estimation
1) Ratios
chance ( which vary from 0 to 1 eg.1/10)
2) Percentage
chance ( which vary from 0 to 100 eg. 50% ) 3) Probability
(which vary from 0 to 1 eg. 0.1)
Probability Method of
estimation
3 approaches to
calculate Probability were showed
1. A
prior ( prior information )
Probability
calculated by logically examining existing information. A priori probability
can most easily be described as making a conclusion based upon deductive
reasoning rather than research or calculation. The largest drawback to this
method of defining probabilities is that it can only be applied to a finite set
of events.
For example, consider how the price of a share can change.
Its price can increase, decrease or remain the same. Therefore, according to a
priori probability, we can assume that there is a 1-in-3, or 33%, chance of one
of the outcomes occurring (all else remaining equal).
The probability that an event will reflect established
beliefs about the event before the arrival of new evidence or information.
Prior probabilities are the original probabilities of an outcome, which be will
updated with new information to create posterior probabilities.
2. Empirical
approach ( information
collected )
Also known as relative frequency, or experimental
probability, is the ratio of the number of outcomes in which a specified event
occurs to the total number of trials, not in a theoretical sample space but in
an actual experiment. In a more general sense, empirical probability estimates
probabilities from experience and observation.
In statistical terms, the empirical probability
is an estimate of a probability. In simple cases, where the result of a
trial only determines whether or not the specified event has occurred,
modelling using a binomial distribution might be appropriate and then the empirical estimate is the maximum liklihood. It is the Bayesian estimate for the same case if certain assumptions are made for the prior distribution of the probability. If a trial yields more information, the
empirical probability can be improved on by adopting further assumptions in the
form of a statistical model: if such a model
is fitted, it can be used to derive an estimate of the probability of the
specified event.
For example, let's say that a manufacturer tested
1000 radios, at random, and found 15 of them to be defective.
We can easily determine that the empirical probability that a radio is defective would be:
P(defective radio) = 15
1000
or...3/200.
As a decimal it would be .015, and
as a percent it would be 1.5%
Now the manufacturer can use this result to predict that in the production of 7500 radios, 1.5% of them will probably be defective. Or, (.015)(7500) = 112.5 defective radios.
3. Subjectivity (
Intuition )
A probability derived from an individual's personal
judgment, understanding and experience about whether a specific outcome
is likely to occur. Subjective probabilities contain no formal calculations.
This can be used to capitalize on background of experienced workers and
managers in decision making.
It’s a way of tapping a persons knowledge to forecast
the occurrence of an event.
Subjective
probabilities differ from person to person. Because the probability is
subjective, it contains a high degree of personal bias. An example of
subjective probability could be asking New York Yankees fans, before the
baseball season starts, the chances of New York winning the world series. While
there is no absolute mathematical proof behind the answer to the example, fans
might still reply in actual percentage terms, such as the Yankees having a 25%
chance of winning the world series.
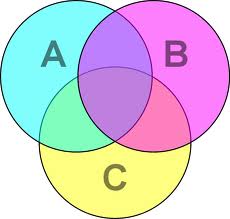
VENN
DIAGRAM:
A Venn
diagram or set diagram is a diagram that
shows all possible logical relations between a finite collection of sets. Venn
diagrams were conceived around 1880 by John Venn. They
are used to teach elementary set theory, as
well as illustrate simple set relationships improbablity, logic, statistics,linguistics and computer science.

Written By:
Pareena Neema
Group Members:
Abhishek Panwala
Raghav Kabra
Poorva Saboo
Parita Mandhana
No comments:
Post a Comment