The class began with me sitting with my Laptop connected to the projector. Statistics was a subject that i was not acquainted to. But the next 3 hours eased my nerves and then i was confident enough to understand and visualise the Market!
A Market problem of the sales of 2 wheelers was taken up by us, where we had to address the issue- in which region did we have the production of 2 wheelers high? We started the analysis by finding the ratio of Population of the state to that of the population of 2 wheelers in that state. We first learnt to label each and every details through the label coloumn. Then we assigned the value of the state such that they were distributed in 5 regions namely-North,East,West,South and Central,it made our task simple as we could easily look into various region and at the same time make out the density of the 2 wheelers used per region. We used various tools like box plot, histogram and descriptive statistics to analyse and evaluate the market which gave us a clear idea that our approach was having a flaw. The flaw was that in pursuit of the ratios we had to ignore leading city like Delhi. So we used the basic tools of Statistics-the 3 M's namely Mean,Median & Mode.
1) Mean is the arithmetic average of a group of numbers.
2) Median is the middle value in an ordered array of numbers.
3) Mode is the most frequently occuring value in a set of data.

Usually we use median instead of mean for accurate solutions.
Overall the lecture seemed inquisitive and the learning was immense.
Team Members
Nishidh Lad
P. Priyatham Kireeti
Priyadarshi Tandon
P Kalyani
P.S.V.P.S.G Kartheeki
A Market problem of the sales of 2 wheelers was taken up by us, where we had to address the issue- in which region did we have the production of 2 wheelers high? We started the analysis by finding the ratio of Population of the state to that of the population of 2 wheelers in that state. We first learnt to label each and every details through the label coloumn. Then we assigned the value of the state such that they were distributed in 5 regions namely-North,East,West,South and Central,it made our task simple as we could easily look into various region and at the same time make out the density of the 2 wheelers used per region. We used various tools like box plot, histogram and descriptive statistics to analyse and evaluate the market which gave us a clear idea that our approach was having a flaw. The flaw was that in pursuit of the ratios we had to ignore leading city like Delhi. So we used the basic tools of Statistics-the 3 M's namely Mean,Median & Mode.
1) Mean is the arithmetic average of a group of numbers.
2) Median is the middle value in an ordered array of numbers.
3) Mode is the most frequently occuring value in a set of data.
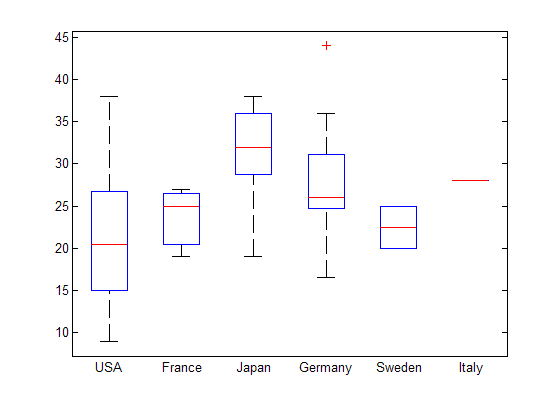
Through the Median and mean approach we learnt that ratio method was wrong,since it didnot cover the cities from all the sections of the boxplots. So we decided to distribute the ratio in a such a way that city with leading 2 wheelers is taken into consideration. According to the distribution in the box plot we need to select the number of cities for the evaluation i.e. one from the top whisker ,one from the bottom whisker and 2 from the boxes. As seen in the figure we have outlier on germany's box. Outliers becomes an important criteria in deciding the market condition. There are 2 types of outliers:- Normal outlier denoted by round and an Extreme outlier denoted by star/plus. The value of a point is 3 times the value of whisker then it is called an outliers.
Overall the lecture seemed inquisitive and the learning was immense.
Team Members
Nishidh Lad
P. Priyatham Kireeti
Priyadarshi Tandon
P Kalyani
P.S.V.P.S.G Kartheeki
No comments:
Post a Comment