DATA INTERPRETATION
USING STATISTICAL TOOLS
After the insightful briefing about Statistics and the SPSS software in the previous class, the second day began with hands on experience of data in practical life. We were provided with a data sheet containing the population of different cities along with the number of two wheelers registered in the years 2009-11.
The first part of the session taught us how to
automatically recode any variable into numbers (the state in the instant case)
followed by the understanding of the process of
grouping of data into two or more groups, i.e. conversion of different
states on the basis of the region they belonged to i.e. north, east, west,
south and central by pre-assigning them
numbers from 1-5. This was followed by the calculation of the percentage
of people using 2 wheelers in a particular region depending on the population
in that area
One
type of measure that is used to describe a set of data is the measure of
central tendency. Measures of central tendency yield information about the
centre , or middle part, of a group of members.
The
measures of central tendency presented here for ungrouped data are mean, mode
,median, percentiles ,and quartiles.
Mean: The arithematic mean is the average of a group
of numbers and is computed by summing all numbers and dividing by numbers and
dividing by the number of numbers .
·
Mean = sum of all
observations / number of observations
·
The mean is the
most commonly used measure of central tendency because it uses all the data and
each data influences the mean.
Median: The median is the middle value in an ordered array of numbers. For an array with an odd number of terms , the median is the middle number
Half of the
values in the data set lie below the median and half lie above the median.
- The median is the most commonly quoted figure used to measure property prices. The use of the median avoids the problem of the mean property price which is affected by a few expensive properties that are not representative of the general property market.
Mode:
The mode of a set of data values is the value that occurs most often.
- It is possible for a set of data values to have more than one mode.
- If there are two data values that occur most frequently, we say that the set of data values is bimodal.
- If there is no data value or data values that occur most frequently, we say that the set of data values has no mode.
Percentiles:Percentiles are measures of central tendency
that divide a group of data into 100 parts. There are 99 percentiles because it
takes 99 dividers to separate a group of data into 100 parts.
- Percentiles are widely used in reporting test results .
- SAT,GRE,GMAT exams use
Quartiles: Quartiles are measures of central tendency
that divide a group of data into four subgroups or parts. The first quartile Q1
is the lower quartile and is equal to 25th percentile. The
second quartile Q2 is the median and is equal to 50th
percentile. The third quartile Q3 is the upper quartile and equals
75th percentile. The difference between the upper and lower
quartiles is called the interquartile range.
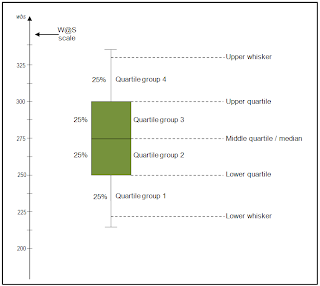
Boxplot: A box plot is a graph that is a valuable
source of easy-to-interpret information about a sample of study. It can provide
information about a sample’s range, median, normality of the distribution, and
the skew of the distribution. The box plot shows a box encased by two outer
lines known as whiskers. The box indicates the middle 50% of the data and the
rest of the 50% is contained within the area between the box and the whiskers.
For
example, consider a sample of 100 IQ scores. The bottom 25% of the scores would
be represented by the space between the lower whisker and the box, the middle
50% would be within the box, and the remaining 25% would be contained between
the box and the upper whisker.
Inside
the box there is a single line which represents the median which is the middle
value of the entire sample. The location of the median line also indicates the
skewness in the distribution if it is too away from the centre.
The
position of the box within the whiskers suggests the normality of the sample
distribution. When the box is closer to the low end, it is positively skewed
and if it is shifted close to the high end it is negatively skewed.
The
size of the box indicates the peakedness of the distribution.
Outliers
are not present in every box plot, although when they are present they are in
the form of points, circles or asterisks outside of the boundaries of whiskers.
They can exist above or below the whiskers of the box.
This
concluded the second day’s session wherein we were exposed to new concepts, at
the same time developing a greater understanding of concepts like mean, median
and mode and how they could be used to derive meaningful information for
analytical purposes.
Name : Pawan Agarwal
Team members
Nilay Kohaley
Pragya Singh
Poulami Sarkar
Priyanka Doshi
Ref : Wikipedia
SPSS Software version 15
Applied Business Statistics-Ken Black


No comments:
Post a Comment