|
"9 out of 10 doctors recommend Oral B"
|
|
|
"8 out of 10 people prefer to buy of brand Y cars"
|
|
|
"The average person on an average buys Z T shirts every year"
|
We all have seen such statistics and relied upon
them as customer. For most of us they merely represent a set of numbers but
have we ever wondered that could be the most vital piece of information that
can be put to use for various purposes to derive meaningful information. Statistics
when properly defined denotes a scientific approach involving collection of
random data, organizing such data and thereafter analyzing such data to interpret
certain results thereof. It can
refer to single facts such as the number of people who like black coffee or the
percentage of cats that is white.
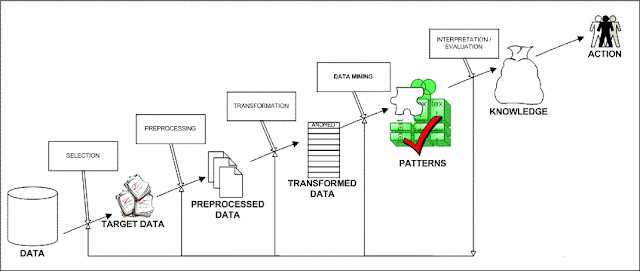
One important aspect
about statistics as pointed out by our professor was that we should learn to
observe the pattern involved in data and moreover an individual should know how
to filter out the useful data through the process of ‘data mining’
The analysis of such
statistics can be carried out on the basis of variables involved namely
CLASSIFICATION
OF VARIABLES-:
Univariate
- Univariate refers to an expression,
equation, function or polynomial of only one variable.
Bivariate
–
Bivariate data is the data that contains two variables.
Multivariate
– It involves more than one variable.
CONTINUOUS
VARIABLE-:
Continuous variables is one which can have
infinite number of different values between two given points. For Eg: There
cannot be a continuous scale of children within a family. If height were being
measured though, the variables would be continuous as there are an unlimited
number of possibilities even if only looking at between 1 and 1.1 meters.It can be divided into two categories :-
1) Continuous Continuous Variable
2) Discrete Continuous Variable
For Eg:- During an experiment, the scientist often
wants to observe the results of changing one variable. Only one variable is
often changed, as it would be difficult to determine what had caused the
relevant response if multiple variables were influenced.
CATEGORY
VARIABLE-:
Examples of values that might be represented in a category variable:
- The blood type of a person: A, B, AB or O.
- The state that a resident of India lives in.
- The political party that a voter in a India might vote for: Congress, BJP, DMK, CPIM etc.
- The type of a rock: igneous, sedimentary or metamorphic.
Data
Measurement-
The appropriateness of the data analysis depends on
the level of measurement of the data gathered. The commonly used levels of data
measurement are as follows
·
Nominal- A variable is said to be nominal when its values represent categories
with no intrinsic ranking .Examples are zip code ,last four digits of mobile
numbers etc.
·
Ordinal
- A variable is said to be ordinal when
its values represent categories with some intrinsic ranking. Examples are vehicle numbers
·
Interval
- A interval variable is a measurement where
the difference between two values is meaningful .Example of an interval is the
difference between a temperature of 100 degrees and 90 degrees is the same
difference as between 90 degrees and 80 degrees
·
Ratio-The
ratio is termed as the relation between
two similar magnitudes with respect to the number of times the first contains
the second.
·
Scale-A
variable can be treated as scale when its values represent ordered categories
with a meaningful metric, so that distance comparisons between values are
appropriate. Examples of scale variables include age in years and income in
thousands of dollars.
TECHNIQUES
OF REPRESENTATION OF DATA-:
·
Bubble
Chart – Bubble
chart is a diverse version of a Scatter chart where data points are replaced
with bubbles. Bubbles charts are generally used for presentation of financial
data. Bubbles of different sizes depending upon the value are used for visual
representation of data.
·
Boxplot
– A Boxplot is
a technique of summarizing a set of data on an interval scale. It is used to
show the shape of the distribution, its central value and variability. Data is
depicted through quartiles. The spacings between the different parts of the box
help indicate the degree of dispersion (spread) and skewness in the data, and
identify outliers.
These are some of the key concepts which we were introduced to during the first two sessions of our "Applied Business Statistics" lecture. It leaves us with a desire to get further insight into the course.
Name :- Poulami Sarkar
Group Members :- Pawan Agarwal
Pragya Singh
Poulami Sarkar
Priyanka Doshi
Nilay Kohaley


No comments:
Post a Comment