Statistics session 17 and 18.
Mean:In mathematics and statistics, the arithmetic mean or simply the mean or average when the context is clear, is the sum of a collection of numbers divided by the number of numbers in the collection. The collection is often a set of results of an experiment, or a set of results from a survey. The term "arithmetic mean" is preferred in some contexts in mathematics an.d statistics because it helps distinguish it from other means such as the geometric mean and the harmonic mean.For example, per capita income is the arithmetic average income of a nation's population.
Suppose we have a data set containing the values  The arithmetic mean A is defined by the formula
The arithmetic mean A is defined by the formula .
.
MEDIAN:In statistics and probability theory, the median is the numerical value separating the higher half of a data sample, a population, or a probability distribution, from the lower half. The median of a finite list of numbers can be found by arranging all the observations from lowest value to highest value and picking the middle one (e.g., the median of {3, 5, 9} is 5). If there is an even number of observations, then there is no single middle value; the median is then usually defined to be the mean of the two middle values, which corresponds to interpreting the median as the fully trimmed mid-range. The median is of central importance in robust statistics, as it is the most resistant statistic, having a breakdown point of 50%: so long as no more than half the data is contaminated, the median will not give an arbitrarily large result.
A median is only defined on ordered one-dimensional data, and is independent of any distance metric. A geometric median, on the other hand, is defined in any number of dimensions.
For any probability distribution on the real line R with cumulative distribution function F, regardless of whether it is any kind of continuous probability distribution, in particular an absolutely continuous distribution (which has a probability density function), or a discrete probability distribution, a median is by definition any real number m that satisfies the inequalities
- The unknown parameters, denoted as β, which may represent a scalar or a vector.
- The independent variables, X.
- The dependent variable, Y.


![\rho_{X,Y}=\mathrm{corr}(X,Y)={\mathrm{cov}(X,Y) \over \sigma_X \sigma_Y} ={E[(X-\mu_X)(Y-\mu_Y)] \over \sigma_X\sigma_Y},](http://upload.wikimedia.org/math/0/7/6/076d3820a46afe55ee680f3c85e34c76.png)
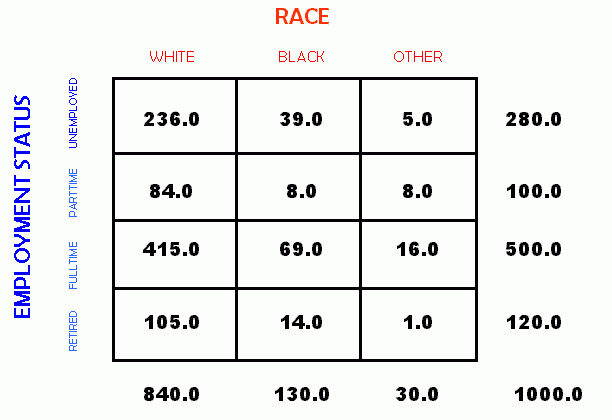
- CROSS TABULATION:
- Cross tabulation (or crosstabs for short) is a statistical process that summarises categorical data to create a contingency table.They are heavily used in survey research, business intelligence, engineering and scientific research. They provide a basic picture of the interrelation between two variables and can help find interactions between them.For example
Sample # Gender Handedness 1 Female Right-handed 2 Male Left-handed 3 Female Right-handed 4 Male Right-handed 5 Male Left-handed 6 Male Right-handed 7 Female Right-handed 8 Female Left-handed 9 Male Right-handed 10 Female Right-handed

MODE:
The mode is the value that appears most often in a set of data. The mode of a discrete probability distribution is the value x at which its probability mass function takes its maximum value. In other words, it is the value that is most likely to be sampled. The mode of a continuous probability distribution is the value x at which its probability density function has its maximum value, so, informally speaking, the mode is at the peak.
Like the statistical mean and median, the mode is a way of expressing, in a single number, important information about a random variable or a population. The numerical value of the mode is the same as that of the mean and median in a normal distribution, and it may be very different in highly skewed distributions.
The mode is not necessarily unique, since the same maximum frequency may be attained at different values. The most extreme case occurs in uniform distributions, where all values occur equally frequently.
.jpg)
T-Test:
A t-test is any statistical hypothesis test in which the test statistic follows a Student's t distribution if the null hypothesis is supported. It can be used to determine if two sets of data are significantly different from each other, and is most commonly applied when the test statistic would follow a normal distribution if the value of a scaling term in the test statistic were known.Independent samples
The independent samples t-test is used when two separate sets of independent and identically distributed samples are obtained, one from each of the two populations being compared. For example, suppose we are evaluating the effect of a medical treatment, and we enroll 100 subjects into our study, then randomize 50 subjects to the treatment group and 50 subjects to the control group. In this case, we have two independent samples and would use the unpaired form of the t-test. The randomization is not essential here—if we contacted 100 people by phone and obtained each person's age and gender, and then used a two-sample t-test to see whether the mean ages differ by gender, this would also be an independent samples t-test, even though the data are observational.
Paired samples
Paired samples t-tests typically consist of a sample of matched pairs of similar units, or one group of units that has been tested twice (a "repeated measures" t-test).
A typical example of the repeated measures t-test would be where subjects are tested prior to a treatment, say for high blood pressure, and the same subjects are tested again after treatment with a blood-pressure lowering medication. By comparing the same patient's numbers before and after treatment, we are effectively using each patient as their own control. That way the correct rejection of the null hypothesis (here: of no difference made by the treatment) can become much more likely, with statistical power increasing simply because the random between-patient variation has now been eliminated. Note however that an increase of statistical power comes at a price: more tests are required, each subject having to be tested twice. Because half of the sample now depends on the other half, the paired version of Student's t-test has only 'n/2 - 1' degrees of freedom (with 'n' being the total number of observations). Pairs become individual test units, and the sample has to be doubled to achieve the same number of degrees of freedom.

REGRESSION:
In statistics, regression analysis is a statistical process for estimating the relationships among variables. It includes many techniques for modeling and analyzing several variables, when the focus is on the relationship between a dependent variable and one or more independent variables. More specifically, regression analysis helps one understand how the typical value of the dependent variable changes when any one of the independent variables is varied, while the other independent variables are held fixed. Most commonly, regression analysis estimates the conditional expectation of the dependent variable given the independent variables – that is, the average value of the dependent variable when the independent variables are fixed. Less commonly, the focus is on a quantile, or other location parameter of the conditional distribution of the dependent variable given the independent variables. In all cases, the estimation target is a function of the independent variables called the regression function. In regression analysis, it is also of interest to characterize the variation of the dependent variable around the regression function, which can be described by a probability distribution.
Regression models involve the following variables:
In various fields of application, different terminologies are used in place of dependent and independent variables.
A regression model relates Y to a function of X and β.

CORRELATION:
In statistics, dependence refers to any statistical relationship between two random variables or two sets of data. Correlation refers to any of a broad class of statistical relationships involving dependence.
Familiar examples of dependent phenomena include the correlation between the physical statures of parents and their offspring, and the correlation between the demand for a product and its price. Correlations are useful because they can indicate a predictive relationship that can be exploited in practice. For example, an electrical utility may produce less power on a mild day based on the correlation between electricity demand and weather. In this example there is a causal relationship, because extreme weather causes people to use more electricity for heating or cooling; however, statistical dependence is not sufficient to demonstrate the presence of such a causal relationship (i.e., correlation does not imply causation).
Formally, dependence refers to any situation in which random variables do not satisfy a mathematical condition of probabilistic independence. In loose usage, correlation can refer to any departure of two or more random variables from independence, but technically it refers to any of several more specialized types of relationship between mean values. There are several correlation coefficients, often denoted ρ or r, measuring the degree of correlation. The commonest of these is the Pearson correlation coefficient, which is sensitive only to a linear relationship between two variables (which may exist even if one is a nonlinear function of the other). Other correlation coefficients have been developed to be more robust than the Pearson correlation – that is, more sensitive to nonlinear relationships. Mutual information can also be applied to measure dependence between two variables.

The population correlation coefficient ρX,Y between two random variables X and Y with expected values μX and μY and standard deviations σX and σY is defined as:
cross tabulation leads to,
| Left- handed | Right- handed | Total | |
|---|---|---|---|
| Males | 2 | 3 | 5 |
| Females | 1 | 4 | 5 |
| Total | 3 | 7 | 10 |
- SUBMITTED BY:
- P.PRIYATHAM KIREETI(2013183)
- GROUP NUMBER:10
- GROUP MEMBERS:
- P.KALYANI(2013184)
- P.S.V.P.S.G.KARTHEEKI(2013198)
- NISHIDH LAD(2013176)
- PRIYADARSHI TANDON(2013211)
No comments:
Post a Comment